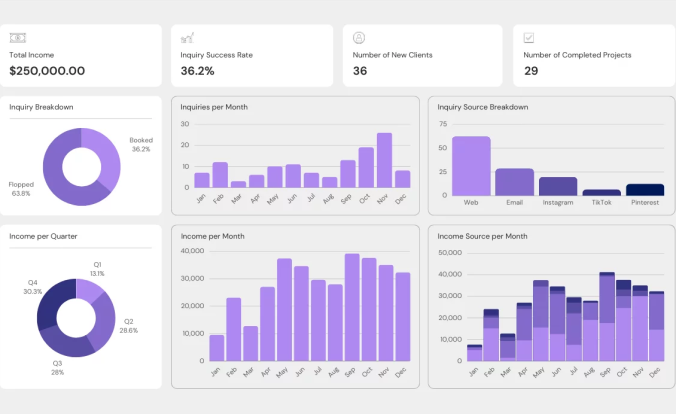
Understand Your Data With
Data Visualization Services!
Identify patterns, trends, and analyze data intuitively to identify opportunities with data visualization consulting services.


100+
Consultants


30+
Projects Completed


15+
Industries Served
Our Achievements


100+
Consultants


30+
Projects Completed


15+
Industries Served
Our Achievements


Data Visualization Experts
Visualize Data Like Never Before!
The ability to collect, analyze, and interpret large datasets has become vital for any thriving organization. However, raw data alone is not enough; it’s the insights gleaned from it that truly matter.
With data growing exponentially in volume and variety, it’s becoming quite challenging for organizations to extract valuable information and make smart decisions.
That’s where data visualization services can be a game changer. It’s an art form that reveals hidden patterns, trends, and relationships, making it possible to unlock the full potential of your data. Our team of data visualization experts provides comprehensive services, ranging from consultation to implementation and support, to assist you in harnessing the power of data visualization.
Data Acquisition
Data Acquisition
Data Acquisition
Data Acquisition
Data Acquisition
- Excel Sheet
- Files
- CRM
Our Process
Integration and Transformation Process of Data Visualization
The process starts by gathering data from sources, like spreadsheets, APIs, and other files. This data is then processed using an ETL (Extract, Transform, Load) engine that cleans, transforms, and combines it into a unified view.
Then the integrated data is loaded into a data repository like a data warehouse or lake for efficient storage, access, and management. Various tools such, as Power BI and Tableau are then used to analyse the data and extract insights and meaningful patterns.
Finally, the analysed data is presented to you in an actionable manner enabling you to make informed decisions based on accurate information.


Process Behind Our Data Visualization Services
Meeting the Client
Requirements Gathering
Data Prep. & Analysis
Mockup Demo
Designing
User Testing
Maintenance/Support
Techniques We Use to Visualize Data Smartly
Tool & Technologies
Data Visualization Tools & Technologies We Use
PowerBI is a cloud-based tool that we leverage to transform your data into interactive visuals for better reporting. Its user-friendly interface and seamless integration with other platforms make it a popular choice for data visualization.
Tableau is an intuitive platform that helps you understand data more meaningfully. Some of its features include creating interactive dashboards, advanced analytical capabilities, and scalability.
A cloud-based data integration platform for creating, scheduling, and managing data pipelines across diverse sources and destinations.
A programming language for managing relational databases, performing queries, and creating database objects, triggers, and stored procedures.
A fast, easy, and collaborative Apache Spark-based analytics platform for data engineering, data science, and data warehousing.
Why Choose Us?
Few reasons for people choosing PPN Solutions
From SAP, Zoho, and Board implementation to web development, staffing needs and digital marketing, we can help you with whatever your business needs to stand out in the market.


REPLAN
Prebuilt Industry Specific Accelerator


Support and Training
Manage Services


Collaborative DNA
Successful Project Delivery


Passionate Team
Innovative and Complimentary Technologies


FAQ
Frequently Asked Questions
Let us illuminate the path forward with a proven track record, unparalleled expertise, and a commitment to turning your financial aspirations into triumphant realities. What sets us apart is not just our proficiency, but the promise of a transformative experience that propels your financial landscape into a realm of unprecedented success. So, why settle for the ordinary when the extraordinary awaits? Choose us, and let's embark on a journey where financial transformation meets unparalleled excellence.
Assessing readiness for transformative FP&A solutions involves monitoring milestones like data complexity, performance bottlenecks, strategic expansion, and signals such as increased collaboration needs and real-time insights demand. Evaluating these indicators guides informed investment decisions.
Our Insights
Blog & News Update
Contact Us
Connect With Our Data Visualization Consultant!
Get a clear and concise view of your data to quickly identify trends, patterns, and insights that would be difficult to discern from raw numbers alone. This allows you to make better, data-driven decisions that drive growth and profitability. With our data analysis and visualization expertise, we help you uncover hidden opportunities, optimize resources, and improve the overall performance of your business.
By presenting complex data in an intuitive and visually appealing way, our data visualization services enable stakeholders across your organization to understand and align around key metrics and goals easily. This fosters collaboration, streamlines decision-making, and ultimately drives better business outcomes. Whether you’re looking to improve supply chain efficiency, optimize pricing strategies, or enhance customer engagement, we can help you achieve your objectives.
Schedule a consultation.
Contact us
Fill in the details!


